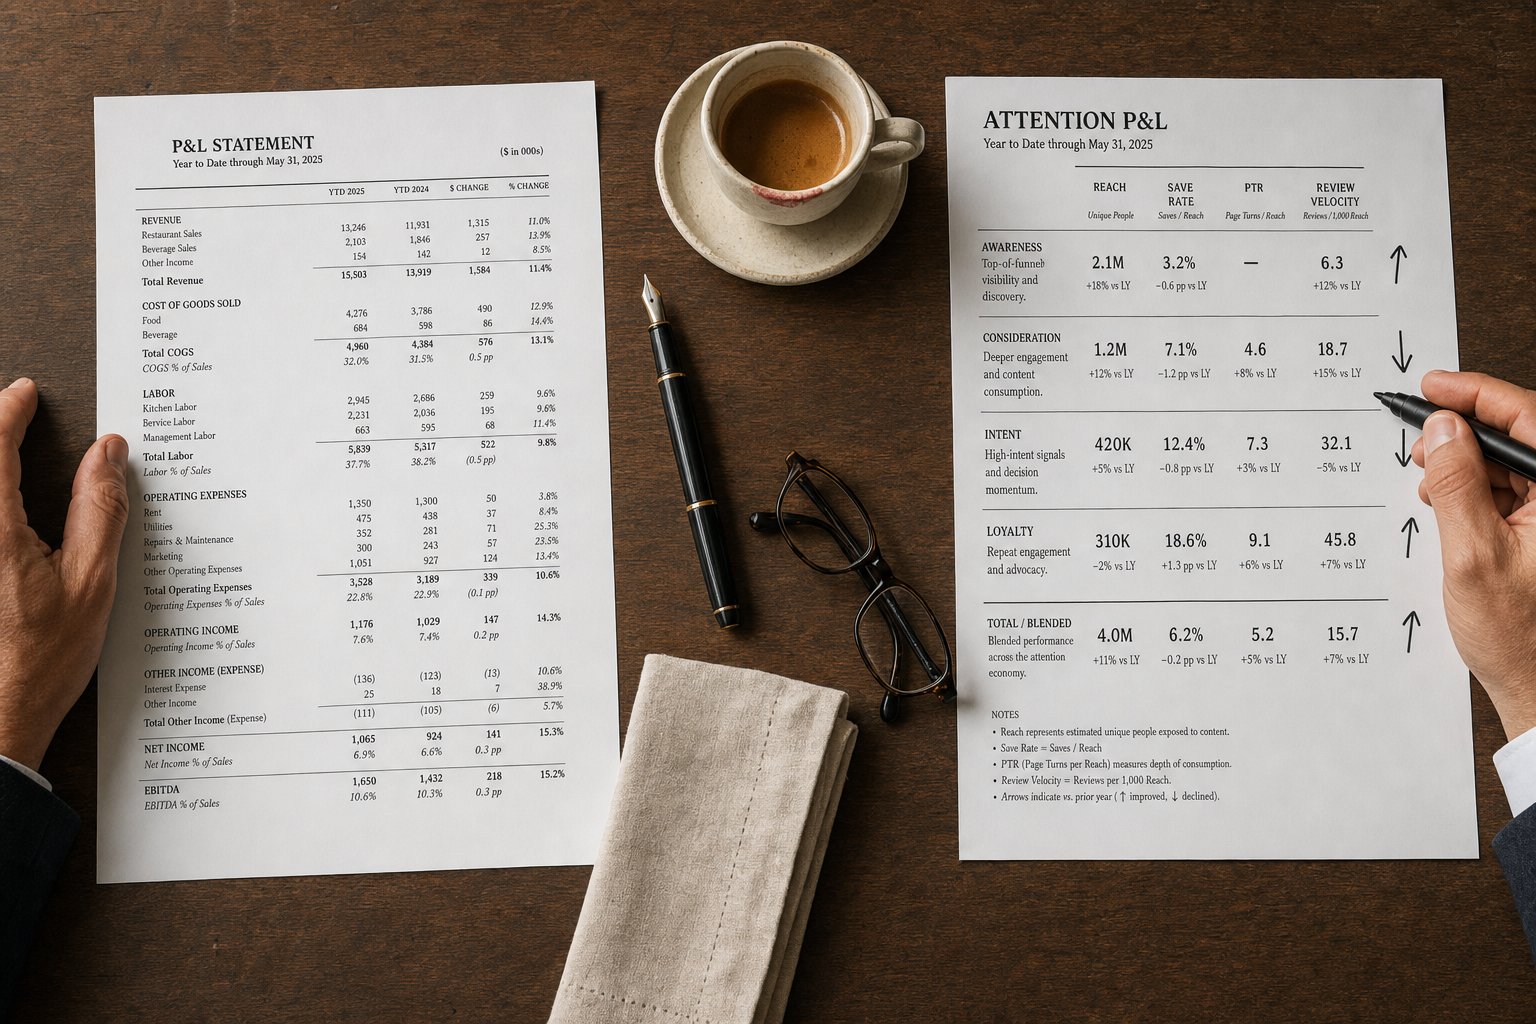
Every operator we've ever met can pull three numbers off the top of their head at any moment.
Food cost percentage. Labor percentage. Yesterday's covers.
Those numbers are important. They're also lagging indicators. By the time your covers dip, the attention that would have filled those seats has already gone somewhere else — three weeks ago, quietly, on channels most operators aren't tracking.
The pattern we see over and over again: a restaurant is doing "fine" on the financial P&L, then hits a rough month that nobody saw coming. Reviewing it in hindsight, the attention had been softening for a quarter. Reach was drifting. Saves were down. Profile-to-reservation conversion had quietly halved. Nobody had measured any of it because nobody had a framework for it.
Attention metrics are leading indicators. Covers are lagging ones. The operators who caught the shift a month earlier — and did something about it — didn't have better instincts. They had a weekly Attention P&L sitting next to the financial one.
This installment is that framework.
The Reframe: A Second P&L, Not a Social Report
Most restaurants that "look at analytics" are doing one of two things:
- Glancing at the Instagram home screen and vibing on whether the numbers "feel up."
- Getting a monthly PDF from an agency full of vanity charts nobody uses to make decisions.
Neither is a P&L. A P&L is a one-page, weekly, comparable, decision-driving document that lives next to the financial one and gets reviewed by the same leadership at the same meeting. That's the standard for money. That should be the standard for attention.
The Attention P&L below fits on one page. It takes 20 minutes to update. And it will tell you what your covers are going to do six to eight weeks before your covers tell you.
The Four Metrics That Actually Matter
There are dozens of possible social metrics. Most of them are noise. The four below are the ones that consistently lead revenue for restaurants — and the ones the top-performing operators track weekly, in this order.
1. Reach (weekly, per platform). Total unique accounts your content touched in the last 7 days. This is the top of the funnel. Reach going up before covers go up is what a healthy restaurant looks like in the algorithm.
- Benchmark to track: week-over-week change, 4-week trailing average, and same-week-last-year.
- Warning signs: reach dropping 3 weeks in a row while post volume is steady = an algorithm signal problem, not a content problem.
- Why it leads: reach shifts appear ~4–8 weeks before revenue shifts for full-service independents.
2. Save Rate (per post + weekly average). The single most under-tracked metric in restaurant social. Saves are the strongest algorithmic signal on food content — and the strongest leading indicator of a future visit. Food content earns 4–8% save rates, versus 0.5–2% for general content (Web Tonic, 2026).
- Benchmark to track: saves as a % of reach, weekly.
- Warning signs: save rate below 2% consistently means the content isn't sticky. Doesn't matter how many posts you're doing.
- Why it leads: saves are a stronger predictor of return visits than likes, comments, or follows.
3. Profile-to-Reservation (PTR) Conversion. The percentage of profile visits (Instagram, TikTok, Google Business) that clicked through to your reservation page in the last 7 days. This is the middle of the funnel and the most operator-controllable metric on the sheet.
- Benchmark to track: PTR% weekly, per channel.
- Warning signs: PTR dropping while reach is flat = your profile or your booking flow is leaking. Fix the leak before spending more on top-of-funnel.
- Why it leads: PTR shifts appear 2–4 weeks before covers.
4. Review Velocity + Sentiment. Number of new Google + Yelp + TripAdvisor reviews in the last 7 days, plus average star rating. This is the bottom of the funnel and the metric with the biggest downside risk. Recall from Part 8: 92% of consumers won't visit restaurants averaging below four stars, and a single negative review can cost you 22% of prospective customers (Medium/Zhovtyuk analysis).
- Benchmark to track: volume weekly, rolling 90-day average rating.
- Warning signs: velocity dropping = engagement is fading. Rating drifting below 4.5 = intervene now.
- Why it leads: the review layer is what a first-time guest sees last before booking. Small movements here move covers meaningfully.
Four metrics. One page. Weekly. That's the whole discipline.
The Weekly Attention P&L (One-Page Template)
Here is the format the best-run independents are using. Copy it. Adapt it. Live in it.
``` ATTENTION P&L — Week of [DATE]
FUNNEL | THIS WEEK | LAST WEEK | 4-WK AVG | YOY | STATUS Reach (IG) | | | | | ⬆⬇➡ Reach (TT) | | | | | Reach (Google) | | | | |
SAVES / STICKINESS Save Rate % | | | | | Top Post Saves | | | | |
MIDDLE FUNNEL Profile Visits | | | | | PTR % | | | | | Reservations | | | | |
BOTTOM FUNNEL New Reviews | | | | | Avg Rating (90d)| | | | |
OWNED Email Opens % | | | | | SMS CTR % | | | | | List Growth | | | | |
DECISIONS / ACTIONS FOR NEXT WEEK 1. 2. 3. ```
The most important row on the entire sheet is the last one: Decisions / Actions for Next Week. A P&L that doesn't produce decisions is a report, not a P&L.
The Monday-Morning Ritual
Format is worthless without cadence. The operating rhythm that makes the Attention P&L actually change decisions:
- Same day every week. Monday morning is the industry standard.
- Same people every week. Owner or GM + content station lead + marketing lead. Three people, 30 minutes, in a room.
- Financial P&L on the left screen, Attention P&L on the right. They're read together, not separately.
- Every metric gets a status arrow — up, down, flat — versus last week, 4-week average, and same-week-last-year. Arrows drive attention faster than numbers.
- Every meeting ends with three decisions — one experiment to run this week, one thing to double down on, one thing to stop doing.
The operators who run this ritual for 12 straight weeks consistently report the same thing: they start seeing softness a full quarter before it would have shown up in covers. That's the whole point.
"Vanity Metrics" Is a Lazy Dismissal
The reflexive industry response to any social metric is to call it a vanity metric and move on. Sometimes that's right. Often it's an excuse.
Here's the operating cut:
- Followers, likes, and comments without context are vanity metrics. They flatter but don't predict.
- Reach, saves, PTR, review velocity, list growth, and email/SMS engagement are leading indicators of revenue. They aren't vanity — they're diagnostic.
The difference is whether the metric moves before the money moves. If it does, it belongs on the P&L. If it doesn't, it doesn't.
What "Good" Looks Like
Rough benchmarks for a healthy full-service independent, based on aggregated industry reporting:
- Weekly reach growth (blended across platforms): 2–5% week-over-week, sustained.
- Save rate on food content: 3–5% is solid, 5–8% is elite (Web Tonic, 2026).
- PTR%: 4–8% is healthy, 8%+ is excellent.
- Email open rate: 35–45% for restaurants — nearly double the 21% all-industry average (US Tech Automations, 2026).
- SMS open rate: 90–98%, with response rates in the 30–45% range (Rezku, 2026; Gartner via Akron Beacon Journal).
- 90-day rolling review average: 4.5+ stars on Google as the floor. Below 4.5, act; below 4.2, drop everything.
Don't optimize to the benchmarks. Optimize to the trend line. A restaurant at 3% save rate and rising is in better shape than one at 6% and falling.
When to Hire vs. Outsource the Analytics Layer
Most independents will run the Attention P&L themselves for the first 6–12 months and should. It's not that complicated, and doing it in-house builds the operating muscle. Three signals that it's time to outsource or hire:
- You're running 3+ locations and can't hold all the numbers in one head anymore.
- You're spending more than $2,500/month on paid social and need real attribution.
- You want to prove owned-audience value to a buyer, banker, or investor — which requires closed-loop revenue attribution.
At any of those thresholds, a part-time analyst (10–15 hours/month) or a specialized marketing ops partner pays for themselves within a quarter. Below those thresholds, keep it in-house.
The Bottom Line
Restaurants have historically been managed on lagging indicators. Financial P&Ls tell you what already happened. In an attention economy, that's not fast enough. By the time your covers dip, the market has been telling you for a month.
The Attention P&L is the operating discipline that closes the gap. Four metrics, one page, weekly review, three decisions. The mechanics are simple. The advantage of doing it while your competitors don't is enormous.
Attention is the business. If you don't measure it weekly, you're not running the business. You're just paying the bills.
Coming next — Part 7: The Physical Restaurant as a Content Set. Why the smartest operators are designing their dining rooms for the camera before the camera fills the table — and the seven shareable surfaces every restaurant should audit.
Want the Weekly Attention P&L as a fillable template — plus the benchmark comparison tool? Subscribe to Food & Beverage Magazine for the download. Meet us at the NRA Show for the "Attention P&L" clinic with operators running it live.